
Perspectives Behind Long-Term Market Gains
January 20, 2026
It’s natural to want the market to behave in a predictable and balanced way. However, it simply doesn’t.
One common misconception is that because stocks have averaged about 10% annually over the long run, they must return around 10% most years. In reality, the market rarely behaves that smoothly.
Since 1926, stocks have only delivered returns between 8% and 12% in six calendar years — meaning most years are either well above or well below the “average.” The market moves in cycles, and those cycles include difficult stretches: downturns, corrections, and periods of uncertainty that can feel unsettling in the moment.
We've broken down S&P 500 annual returns year-by-year since 1926 below:
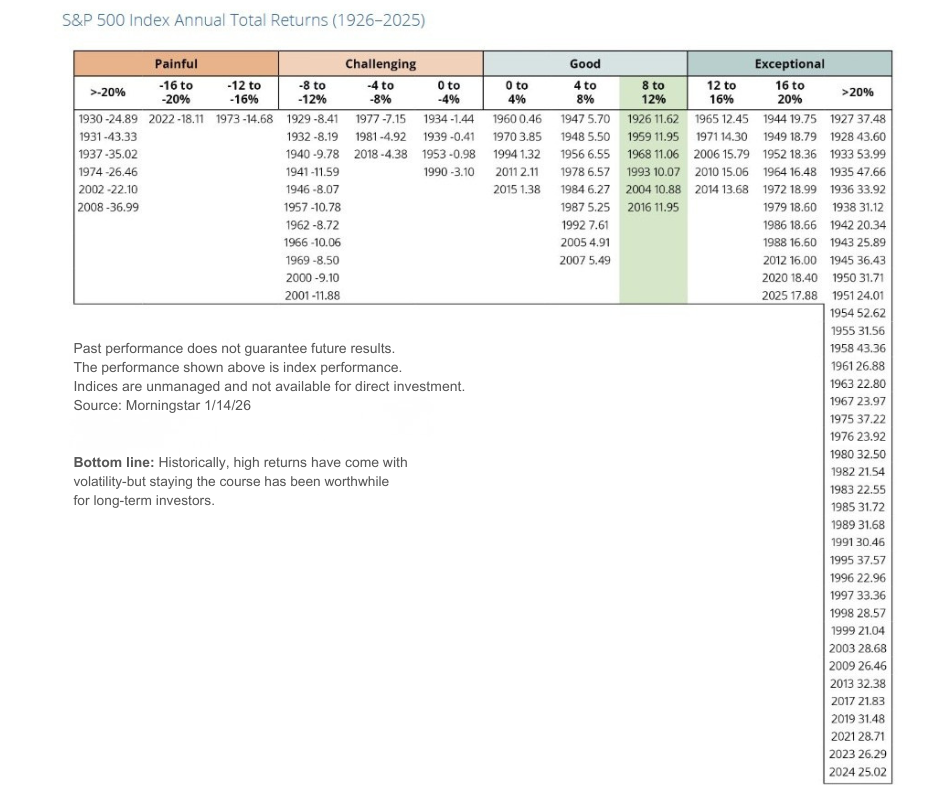
Here’s the key takeaway: volatility is not always a sign that something is broken. Instead, it is a normal part of investing. In fact, volatility is often the “price of admission” for long-term growth. If markets never fluctuated, long-term returns would likely be much lower.
It’s also important to remember that the market has historically been forward-looking. Periods that feel the most uncertain tend to be when prices are adjusting and future expectations are being reset. That process can be unpleasant. However, it’s part of how markets work.
This is why we place so much emphasis on financial planning. The work we've done together is designed to help support your goals through good years, challenging years, and everything in between.
If you have specific questions or would like to discuss your own investment strategy or financial planning needs, we welcome you to contact us to set-up a time to discuss further.
Disclosures:
All investing involves risk, including loss of principal. Indexes are not investments, do not incur fee and expenses and are not professionally managed. It is not possible to invest directly in an index.
This material is for general information only and is not intended to provide specific advice or recommendations for any individual. This information is not intended to be a substitute for specific individualized tax advice. We suggest that you discuss your specific tax situation with a qualified tax advisor. The charts above are for illustrative purposes only.
S&P 500 Index is a market capitalization-weighted price index composed of 500 widely held common stocks. Diversification does not ensure a profit or protect against a loss in declining market. This material is provided for educational purposes only.
The market indexes discussed are unmanaged, and generally, considered representative of their respective markets. Index performance is not indicative of the past performance of a particular investment. Indexes do not incur management fees, costs, and expenses. Individuals cannot directly invest in unmanaged indexes. Past performance does not guarantee future results.