

How Do Midterm Election Years Impact The Stock Market?
September 1, 2026
With the November midterm elections approaching, political headlines and campaign coverage are likely to become a bigger part of the daily news. As the election draws closer, questions naturally arise about what the outcome could mean for the markets and long-term financial planning.
Elections are important, and the decisions made in Washington can influence tax policy, government spending, regulation, and other areas of the economy. When it comes to investing, history provides some helpful perspective.
What Does History Tell Us About Election Years & Market Performance?
It can be tempting to assume that election years create greater market uncertainty or that one political outcome may be better for investments than another. History, however, tells a broader story.
Since 1933, the S&P 500 has delivered positive average total returns across each type of election cycle:
- Non-election years: 15.9% average total return
- Presidential election years: 11.6%
- Midterm election years: 8.6%
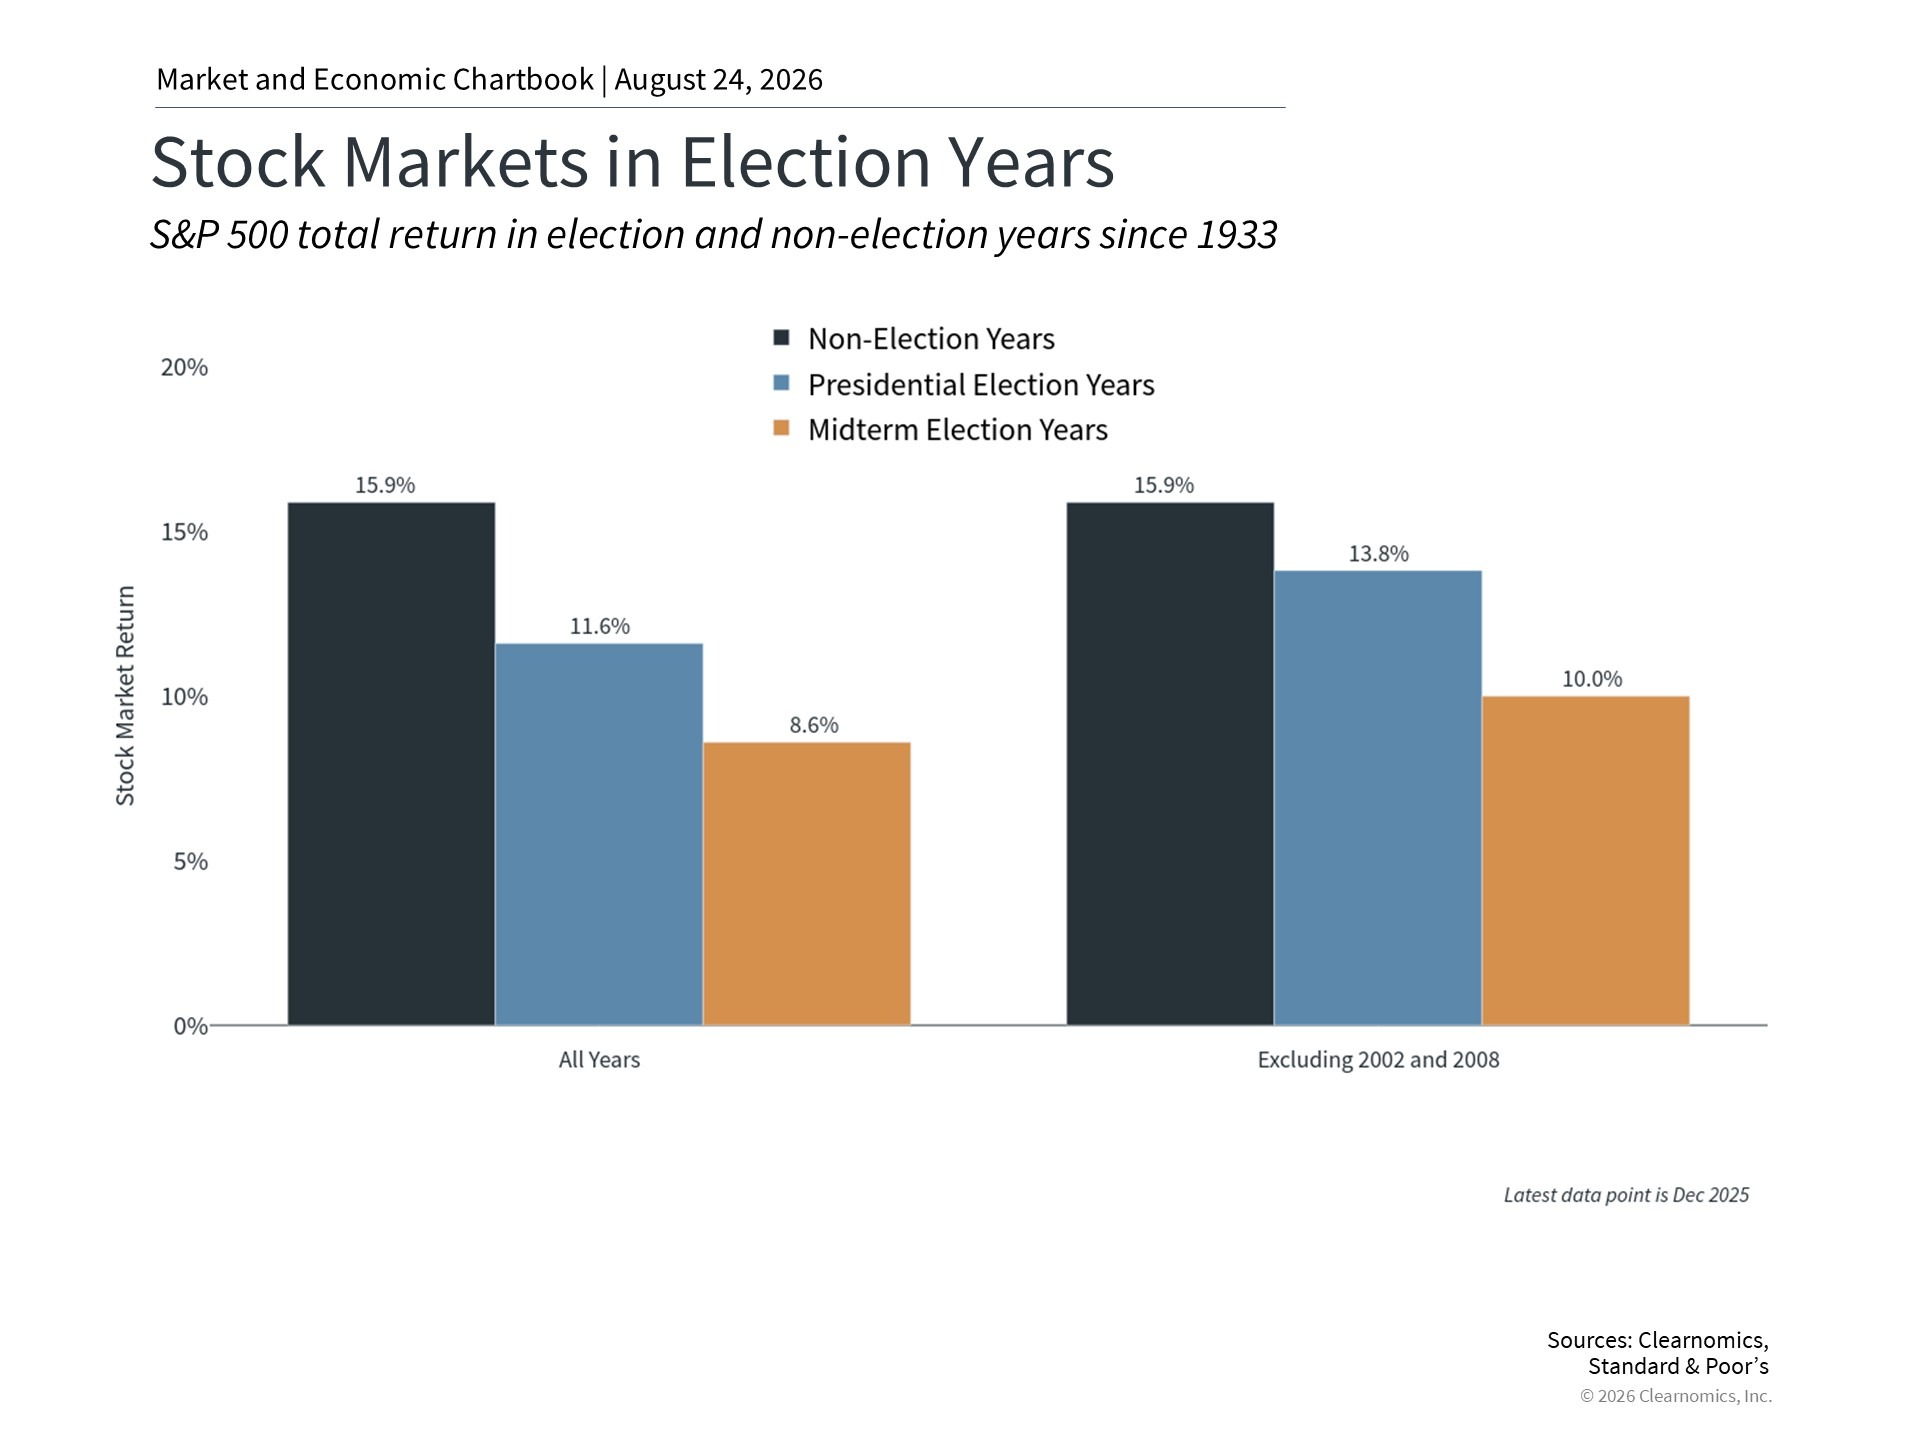
Two particularly difficult market years were 2002 and 2008. When those years are removed from the data, the average return for midterm election years rises from 8.6% to 10.0%. Presidential election years averaged 13.8%, while non-election years averaged 15.9%.
While averages do not tell us what will happen in any individual year, they provide an important reminder: markets have historically delivered positive average returns during election years, including midterm years.
The Economy Often Matters More Than The Election
While election-year headlines can contribute to uncertainty and market volatility, it is important to remember that broader economic factors tend to have a greater influence on market performance.
Corporate earnings, inflation, interest rates, employment, economic growth, and innovation have historically played a greater role in long-term market performance. Even during challenging election years, other economic forces have often been at work.
In 2018, markets were navigating uncertainty around global growth and Federal Reserve policy. In 2022, the focus shifted to high inflation and rapidly rising interest rates.
The lesson is not that elections do not matter. It is that election results are only one piece of a much larger economic picture.
Elections & Your Financial Plan
Rather than trying to anticipate how markets may react to an election outcome, we believe the more productive approach is to remain focused on the things that can be planned: your goals, your time horizon, your cash flow needs and your risk tolerance.
Regardless of who wins, stocks with strong long-term fundamentals will often rally once the campaign spotlight fades. Pre-election market turbulence can create buying opportunities for investors who can tolerate short-term volatility.
Our team is actively monitoring economic developments and technical indicators to make wise and appropriate investment choices. If you have questions about what current events may mean for your financial plan, please Contact Us.
Disclosures:
Investments are not FDIC-insured, nor are they deposits of or guaranteed by a bank or any other entity, so they may lose value. Past results are not predictive of results in the future.
All investing involves risk, including loss of principal. Indexes are not investments, do not incur fee and expenses and are not professionally managed. It is not possible to invest directly in an index.
This material is for general information only and is not intended to provide specific advice or recommendations for any individual. This information is not intended to be a substitute for specific individualized tax advice. We suggest that you discuss your specific tax situation with a qualified tax advisor. The charts above are for illustrative purposes only.
Source: Clearnomics, Standard & Poor's. S&P 500 total return data since 1933. Latest data point December 2025. Past performance does not guarantee future results.